
Analyzing your reading trends at the end of each year is not only a fun and nerdy activity, but it also provides valuable insights into your habits and creates visually appealing spreads for your reading journal. For heavy readers, this can even become a monthly ritual or a regular feature after every 10 books. Let’s dive into how you can track, analyze, and reflect on your reading habits for the year to come:
Tracking Your Reading
The first step is to establish a consistent method to track your reading. Personally, I like to keep a physical reading journal, but also use Notion to house my data for end-of-year stats—but Excel or Goodreads works just as well. (Here’s where you can export your data from either Goodreads or Notion as a CSV file to make the year-end analysis much easier.)
Whether you prefer a pen-and-paper physical journal or the convenience of digital tools like Goodreads, StoryGraph, or a custom tracker in Excel or Notion, the goal is to capture data that’s meaningful to you. Here are some ideas for what you might want to track:
Start with the basics: title, author, publication year, page count, date read, and your personal rating. Then, consider going deeper with extras like:
- Genre: Depending on your reading habits, you could split this into subgenres (ie, I’ve started including romantasy separately from fantasy, but you could split romance into contemporary vs. historical, or split genres by target audience like adults vs YA)
- Format (Physical, eBook, Audiobook, Graphic novel…)
- Source (Library, Bookstore, Book subscriptions, Audible, etc)
- Tropes: Identify recurring themes or narrative elements you enjoy reading
- Demographics: Record author and character details, such as country of origin, ethnicity, gender, or LGBTQIA+ representation. This is an excellent way to push yourself to explore diverse perspectives.
- Ownership: Log whether you purchased or borrowed a book.
Analyzing Your Data
Once your data is compiled, it’s time to look for patterns and trends. The easiest place to start is with immediate stats:
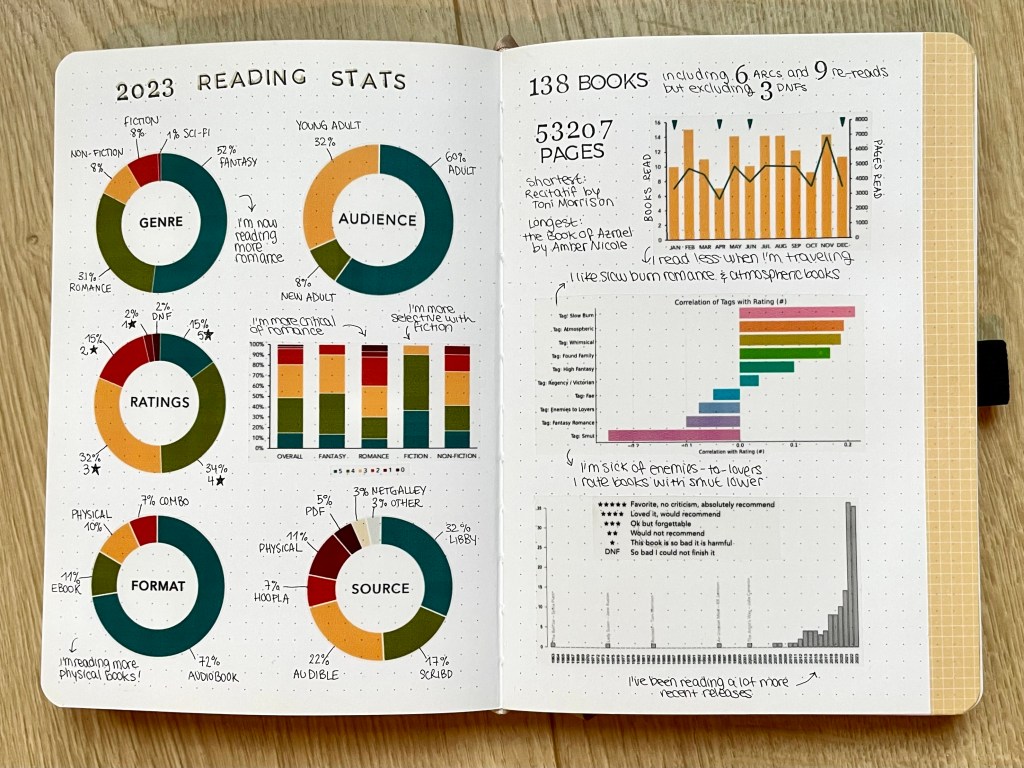
- Number of books read
- Total page count, shortest and longest books
- Number of re-reads
- Number of DNFs (books you did not finish)
To visualize your reading habits and make your spread interesting, graphs and charts are your best friends. I use two main types of graphs:
- Bar graphs to visualize books or pages read per month and the distribution of publication years.
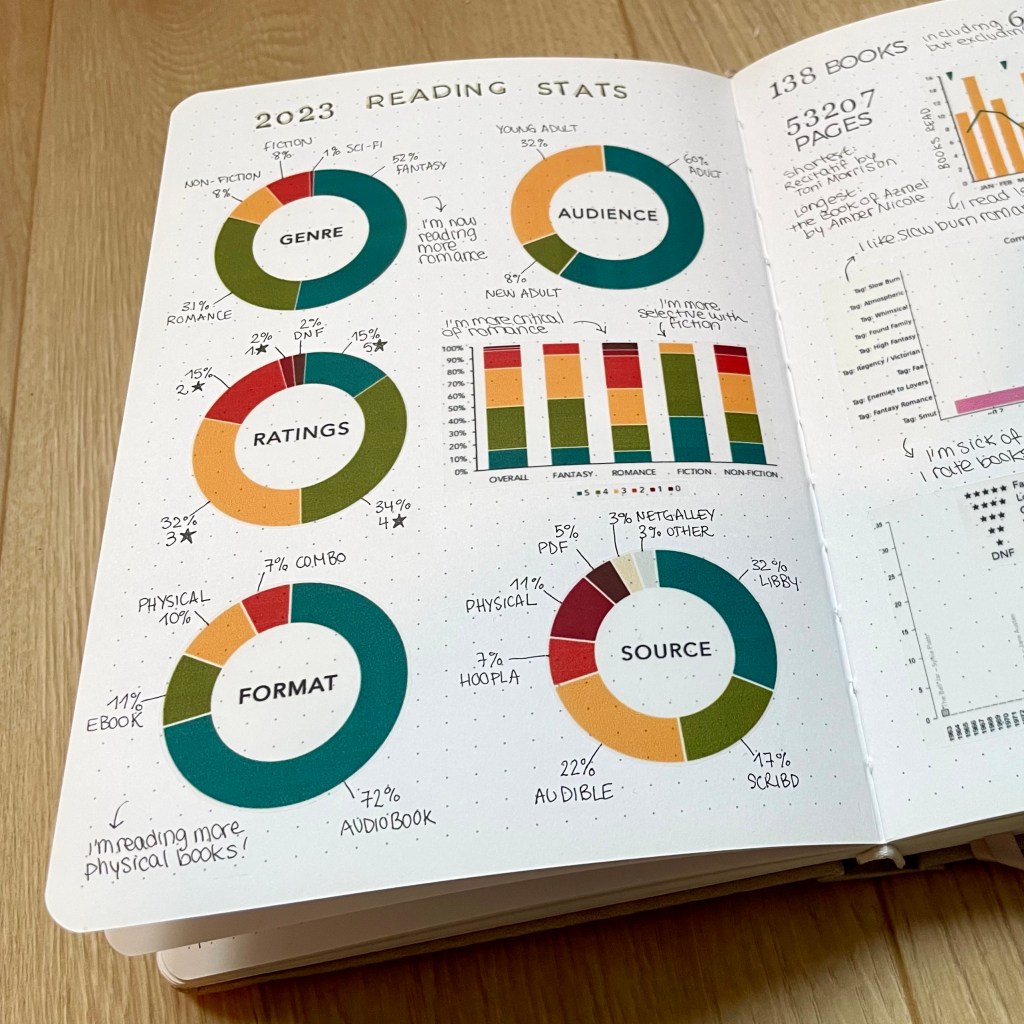
- Pie (or donut) charts to break down your ratings, genres, formats, sources, and author or character demographics. If you choose to make these by hand in your journal, try using these donut chart stickers to make the task easier!
For those who love detailed analysis, here are my favorite “above and beyond” metrics:
- Genres by month to see seasonal trends
- Ratings by genre to understand your preferences and rating trends
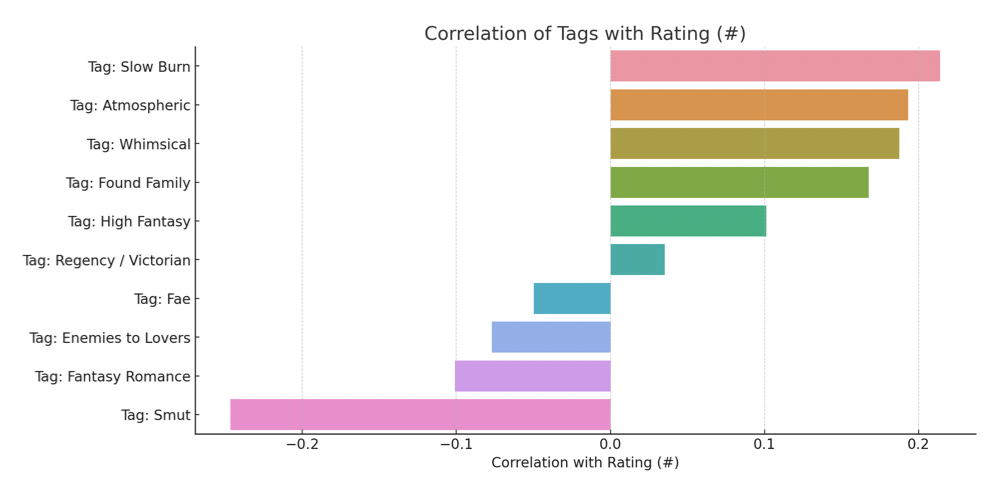
- If you’re feeling ambitious, upload your stats file to tools like ChatGPT to plot correlations, such as how specific tropes influence your ratings. There’s tons of correlative analysis it could do for you, but the free version only allows you to a few analyses per day, so make sure you prioritize!
Reflecting on Your Reading Habits
Stats and visuals are fun, but the true value lies in reflection. I like to write down observations on my journal spreads and use them to create my reading goals for the coming year. Here are some examples:
- Seasonal Genres: My data showed I read more romance in the summer and more fiction in the winter months, which helps me set realistic monthly TBRs throughout the year
- Series Habits: I discovered I was starting more series than finishing them, so I set a goal to read one book from an ongoing series each month, and started adding a series tracker in my reading journal.
- Diversity Goals: Realizing I wasn’t reading enough books from diverse perspectives motivated me to prioritize BIPOC authors the following year.
- Genre Ratings: Fiction books received my highest ratings despite being a smaller portion of my reading. This inspired me to include more fiction in my priority TBR.
Comparing Trends each year
One of the most rewarding aspects of tracking your reading data is comparing trends over multiple years. These insights can help you understand how your habits evolve and whether you’re achieving your reading goals. Here are some personal examples:
- Format Trends: I started with mostly audiobooks but noticed an increase in physical reads and tandem audio-physical reading. This personal trend only reinforced my belief in audiobooks as a fantastic way to reignite a reading habit, especially if you initially have trouble concentrating on physical books for extended periods of time!
- Genre Trends: Each year, the proportion of romance books I read has steadily increased, reflecting a shift for this genre from occasional palate cleanser to new favorite.
Setting New Reading Goals
With insights from your reading data, setting new goals make your TBR more intentional. Here are some suggestions for how to set your reading goals for the new year:
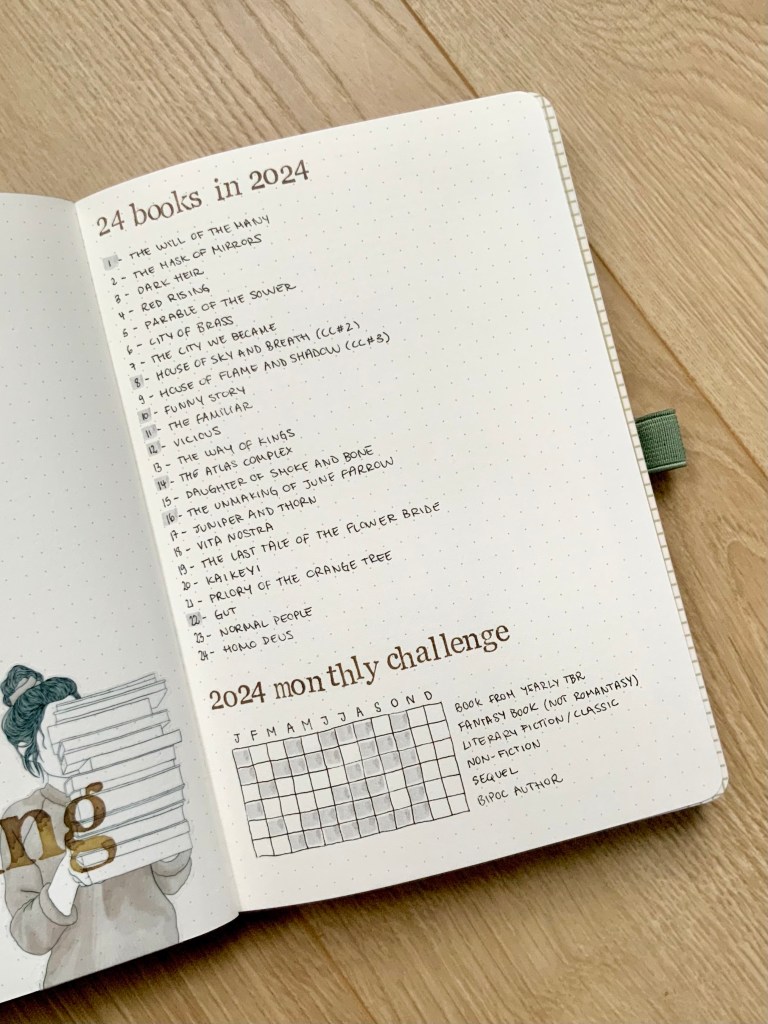
- Priority TBR: Create a list of high-priority books you’ve been meaning to read and focus on tackling them in the coming year. For 2025, for example, I’ll call this list my “25 Books in 2025.” While I know I might not get to all of them, it helps me focus on books I’m genuinely excited to read.
- Monthly Reading Goals: Set smaller, more achievable targets, such as reading a specific number of books, or books from selected categories each month. For example, based on my personal reading stats, I set a goal to finish one book from an ongoing series, one book by a BIPOC author, and one literary fiction book each month.
- Yearly Challenges: Join or create challenges like the “Read Around the World” challenge where you commit to reading books from different countries or a “Book Bingo” where each box is one of your reading goals.
Tailoring your goals to your past trends ensures they’re realistic, motivating, and fun to follow through on all year.
Additional End-of-Year Spreads
If you want to add more creative end-of-year spreads to your reading journal, here are some of my favorites:
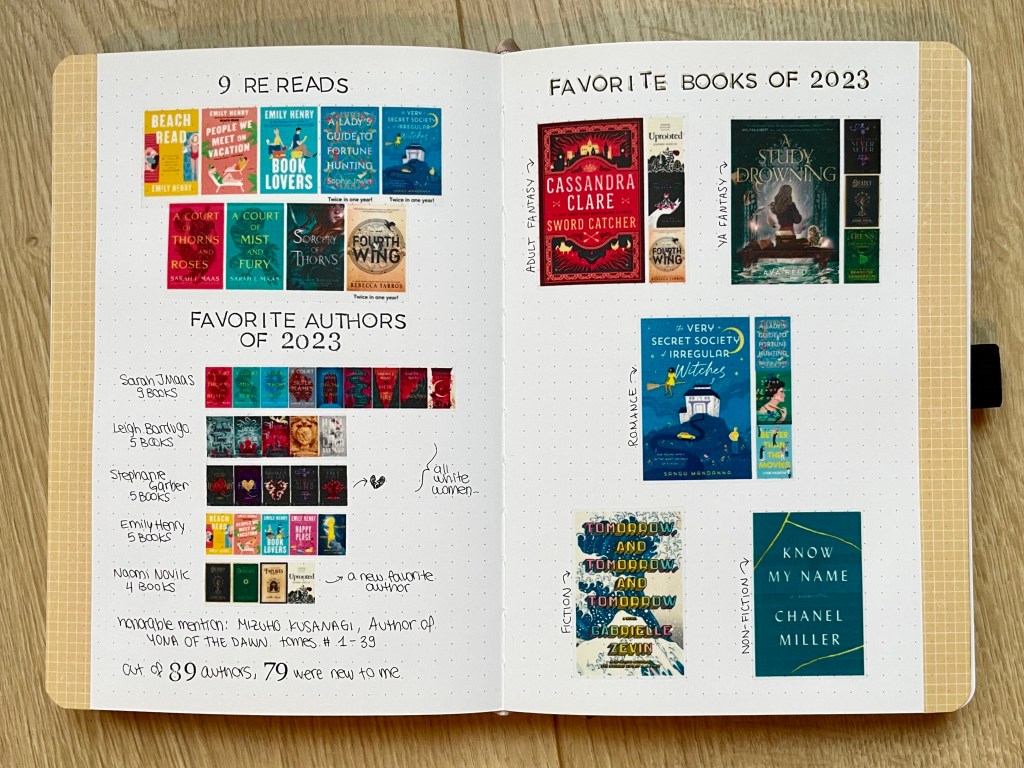
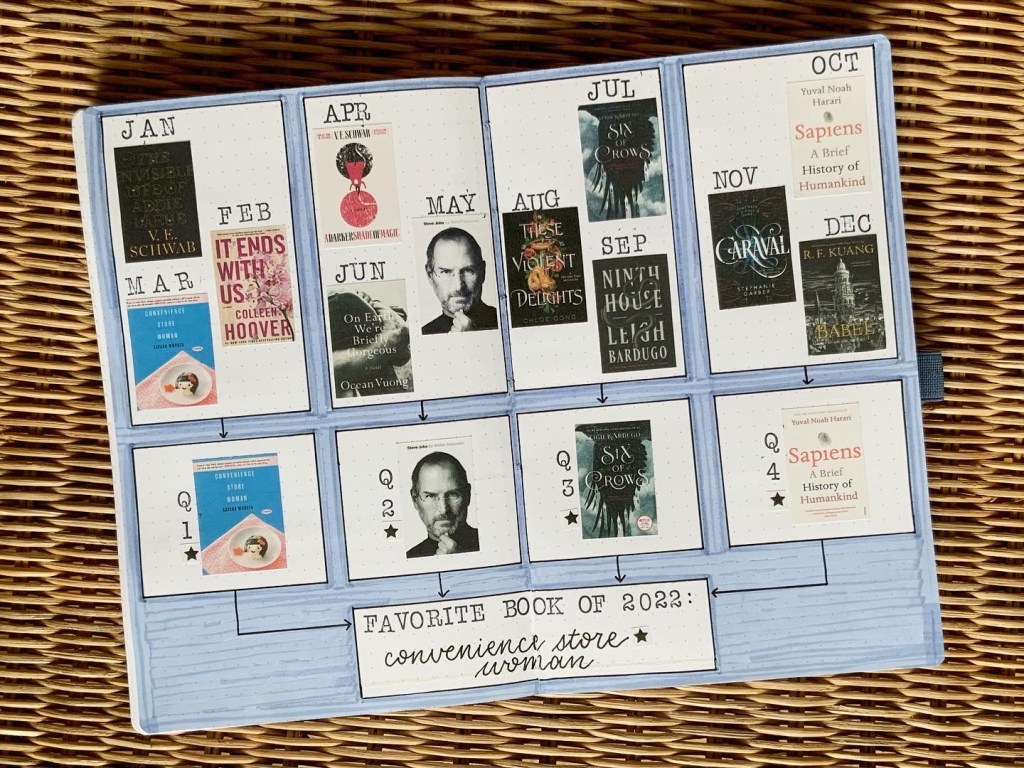
- Book Brackets are a fun way to crown your favorite book of the year by putting your favorites from each month in competition!
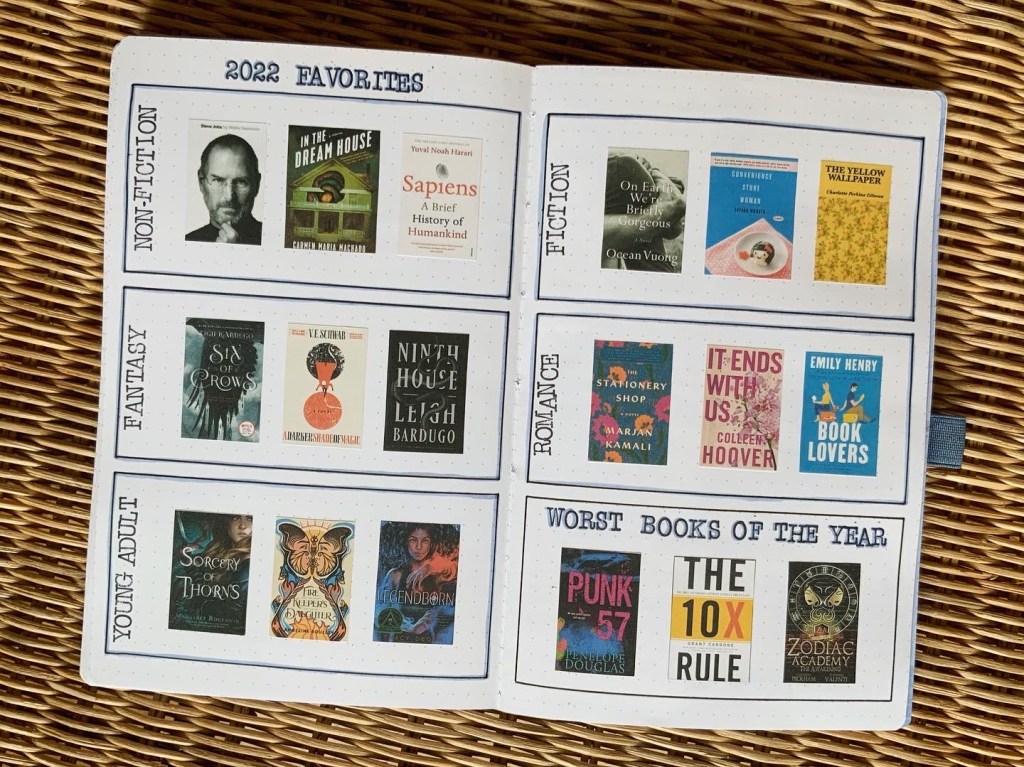
- Highlight your Favorites by Genre for a colorful snapshot of your top reads.
- Record your Most Read Authors by using book covers to create a bar graph.
- Review your Book Budget to see how much you spent and where you might save.
- Reflect on your Book Club or Subscription Picks to evaluate if they’re worth continuing.
Decorating Your Spread
Once your data is analyzed, add the finishing touches to your reading stats spreads: use stickers, washi tape, or stamps to decorate your end-of-year reading spreads. Since these spreads tend to be quite heavy with graphs and book covers already, keep the decorations light by choosing a specific theme or color palette, and keep the same theme for all of your end-of-year spreads. For inspiration, check out my bookish stickers, pressed flower stickers, or watercolor stickers on Etsy.
I hope these tips help you create beautiful spreads and reflect on your reading habits in a fun little exercise. Check out my post on setting up your reading journal for more bookish content & ideas! Happy journaling, and happy reading!
